
 APIs
APIs


 Back
Back
How are other blockchains doing amidst the skyrocketing Ethereum transaction fees? Tokenview
The Ethereum transaction fees surged tenfold in May! What used to cost three to five cents for a transfer now requires two to three dollars. How much time is left for other blockchains?
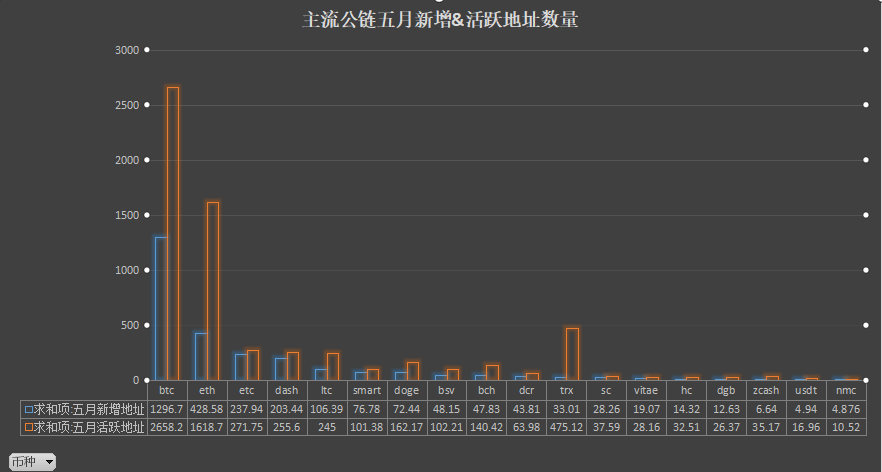
In May, the total number of active addresses on the Bitcoin network reached 26.5821 million, a 14.18% increase from April's 23.2803 million, with a growth rate rising by 9.19%. The number of new addresses was 12.9672 million, a 9.28% increase from April's 11.8663 million, with a growth rate rising by 3.13%.
For Ethereum, in May, the total number of active addresses on the network was 16.1877 million, a 6.70% increase from April, with a month-over-month growth rate rising by 3.79%. The number of new addresses was 4.2858 million, a 16.20% decrease from April.
Among mainstream projects, LTC and BCH saw an increase in the number of active addresses by over 20%, while NEO, TRX, ETC, and ZCASH experienced a decrease in active addresses of over 10%, securing top positions on the increase and decrease charts. It's important to note that significant growth or decline may not necessarily correlate with the market, but the distribution at both ends could indicate potential trends in the projects' recent market performance.
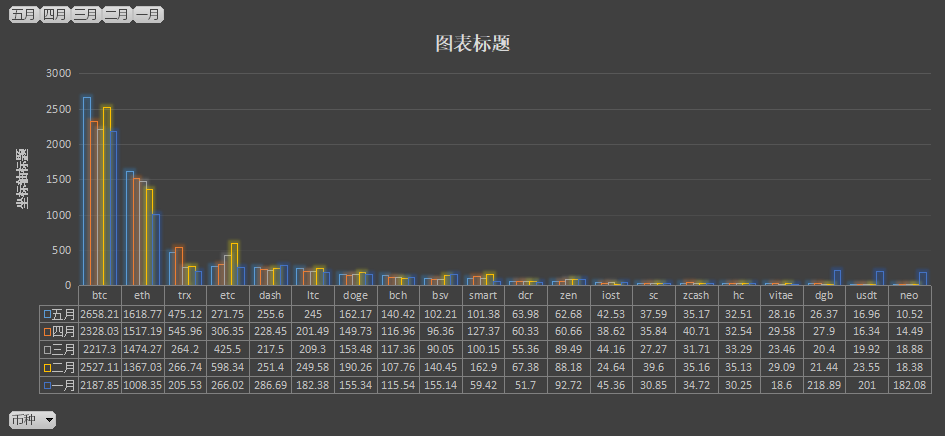
Looking at it separately, after experiencing two consecutive months of stagnation, Bitcoin's total active addresses have reached a new high for the year, surpassing the 25 million mark seen in February. This aligns with the recent sustained strength in the market.
On the other hand, Ethereum has continued to maintain steady growth, with the number of active addresses increasing month after month. This sustained upward trend indicates that activities on the Ethereum network are continuously expanding, with significant contributions from activities such as Defi and stablecoins.
We have examined transaction fees and miner revenue on Ethereum during the same period. It can be observed that Ethereum's transaction fees have been steadily increasing, with fees accounting for approximately 12% of miner revenue in the past thirty days.
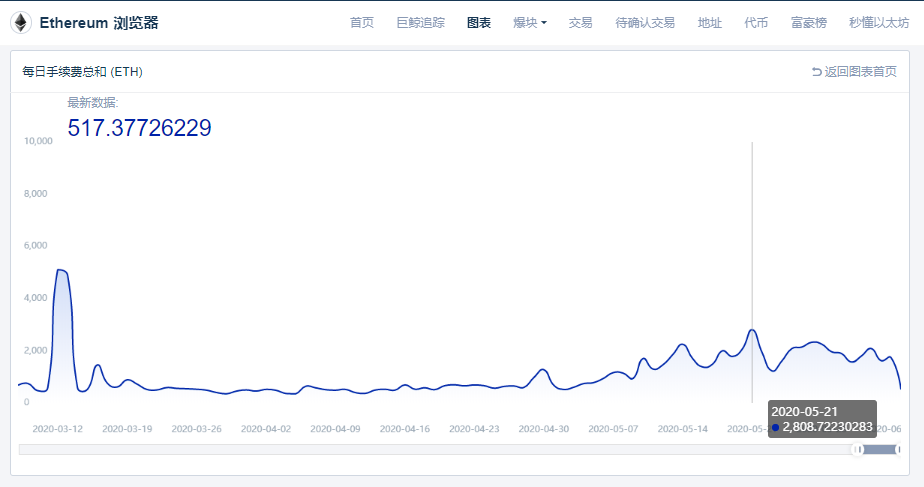
The continuous rise in transaction fees, while potentially causing some inconvenience for users, also reflects the development of various dApps and applications on the Ethereum network. This development, in turn, strengthens Ethereum's position as a leader among public blockchains. It gives us reason to look forward to the launch of Ethereum 2.0.
The transaction fee can also reflect the real activity on a blockchain network. This relationship is similar to how you can understand the real user data of an internet company by investigating the recent number of captcha issuances.
An interesting phenomenon is that after Bitcoin halving, the transaction fees on the blockchain skyrocketed.
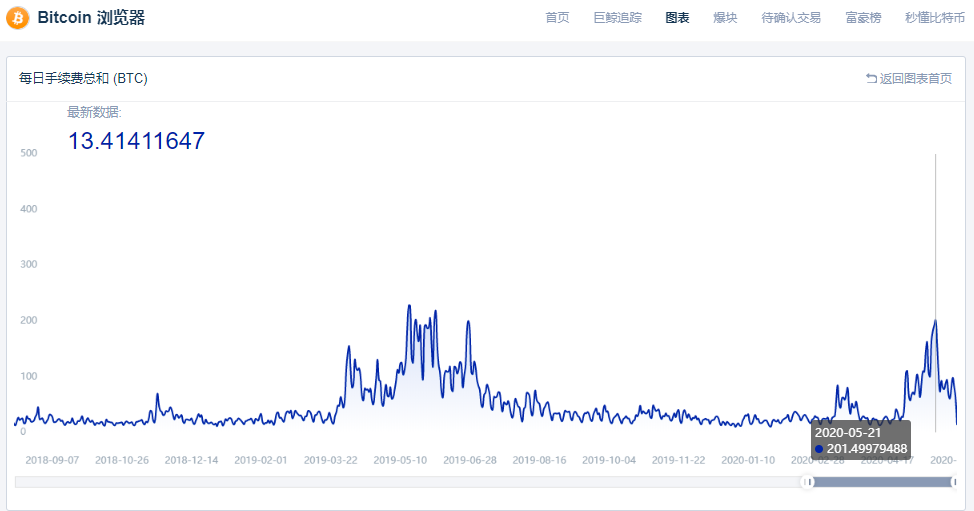
The rise in transaction fees usually indicates a surge in people's demand for transfers. The last time Bitcoin transaction fees surged was in May 2019, you know.
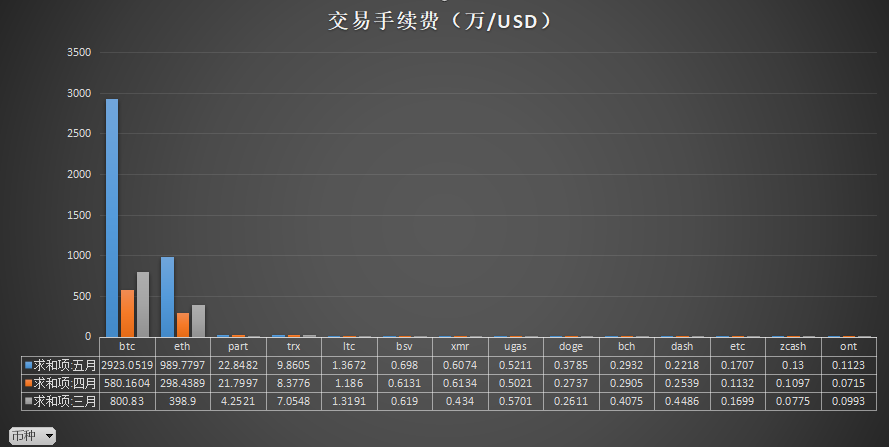
It might be a bit awkward when considering the current situation of other public chains excluding Ethereum and Bitcoin.
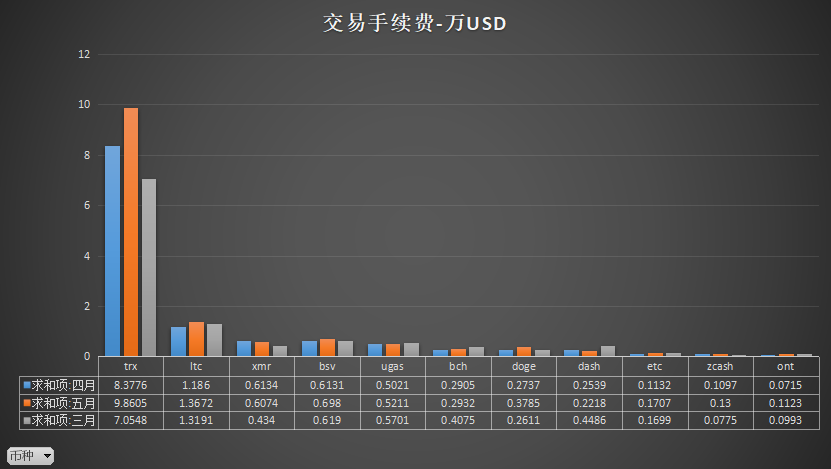
Most public chains have transaction fees of less than $10,000 for a month. In other words, miners' income mostly comes from block rewards. Ideally, we would prefer to see the proportion of transaction fees in miner revenue constantly rising, while the proportion of block rewards slowly decreasing, thus achieving the true implementation of the public chain.
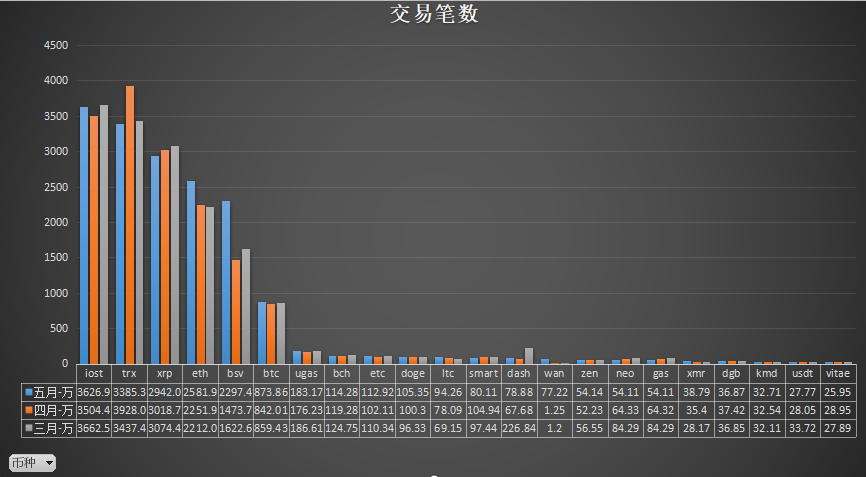
Transaction count can be considered as a combination of the performance and implementation of the public chain. On the one hand, the transaction count is closely related to the block time, which is also the main reason why IOST, Tron, and Ripple can occupy the top three positions.
On the other hand, the implementation of the project itself will bring more on-chain transaction counts. Although Ethereum and Bitcoin do not have an advantage in block time, their overall volume still enables them to rank high in this data.
In addition, we also noticed some unusual activities in certain projects. WanChain's on-chain transaction count experienced a sudden surge in May, which may suggest that the once-star project will make some moves in the near future. Meanwhile, on the OMNI chain, the activity of USDT has been declining for consecutive months. Slow transfers and high fees, coupled with the remarkable performance of USDT on Ethereum and Tron blockchains, have exposed the inherent flaws of OMNI.
Overall, the on-chain activity in May gives us a more optimistic view of the recent trends in the cryptocurrency market.
But at the same time, every project that once claimed to be 'Blockchain 3.0' may now face similar challenges: how to attract enough developers and community support to develop their own ecosystems in the current landscape.


